
This blog is part of the series: What is <this tech> and what is it used for?
Copilot answer
Power BI is Microsoft’s business intelligence platform that combines desktop, cloud, and mobile tools to connect to data, transform and model it, and build interactive visual reports.
It is used to create dashboards and visualizations that reveal trends, track KPIs, and turn raw data into actionable insights.
Organizations and analysts use Power BI to share reports, enable data-driven decisions, automate refreshes, and embed analytics into apps and portals.
Explain it to me like I’m 10 years old
Power BI is like a smart toolbox that takes lots of numbers and facts from different places and turns them into pictures and charts.
It helps you spot important things quickly, like which toys are most popular or when homework gets done late.
You can share those pictures with friends or teachers so everyone can understand the story the numbers are telling.
Specialist answer
Laura Graham-Brown, a freelancer Power-BI expert
Power BI is the tool to display your data to tell a story that the business understands.
It’s used to transform unstructured data, query structured data and create relationships between the data.
The visuals can be displayed across the Microsoft suite from teams to PowerPoint slides.
Cathrine Wilhelmsen, Principal Consultant and Tech Lead at Evidi
Power BI lets you explore and visualize all your data so you can more easily understand what’s happening, how things have changed over time, and see where you need to take action.
Think of it as creating pretty reports by dragging and dropping graphs, charts and summaries on top of all your Excel files and business applications!
You can use Power BI Desktop to dig into details on your own, or share polished reports in Power BI online to collaborate with your coworkers.
Explain it like it’s my first day on the job
All the reports and colourful charts and lists we have helping us make decisions based on our data, or showing us what we’ve sold – it’s all Power BI! We get nice and helpful reports and it helps management be data driven… Well, I wish the last statement was true, but Power BI is just a tool to help you.
Power BI is the most used and known tool in the Power Platform. With about 97% of the Fortune 500 using it! It’s an easy way to get insights on the data we have. We can connect it to most data sources and create insightful reports. You can use visuals to see your data different ways. Developers can even create new visuals to show data.
First thing you have to connect to your data source. This can be Dataverse, Excel or any other data source you have access to. Which data you have will give you some guide on which visuals you should create.
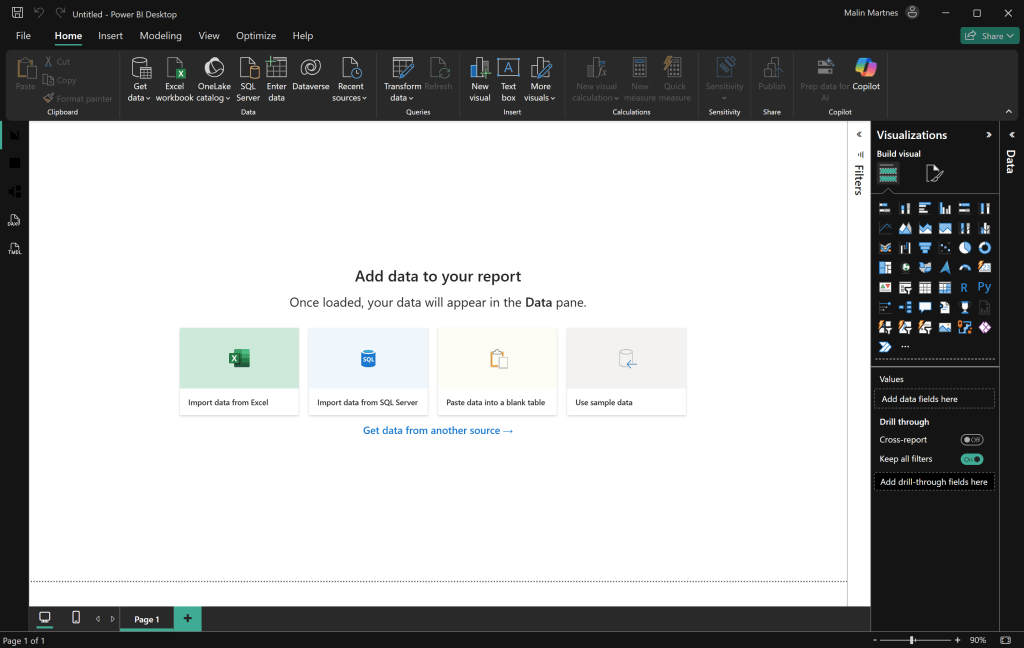
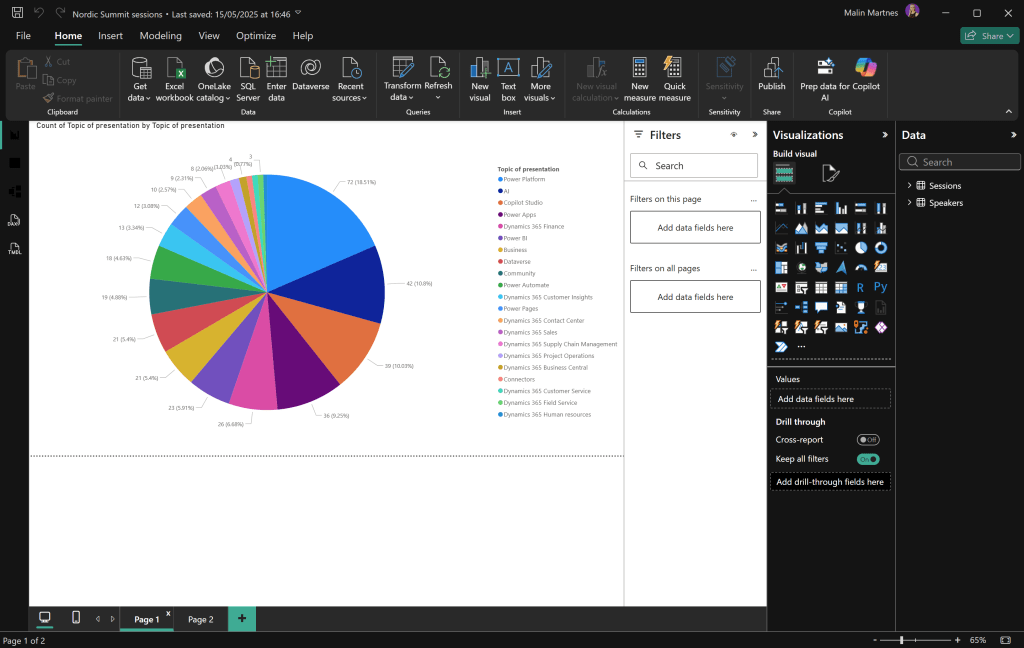
Now you can create all kinds of reports based on the data you have.
Use cases with large customers
A family member works in sales in a large organisation, they had an old and outdated sales system. They punched in the data and it was like throwing the data in a black hole. They started their digital transformation by putting Power BI on their old system. All of a sudden the sales people had an overview over their sales and could sit at home looking at their stats and sales. It might seem like a simple thing, but for them, it was a brand new world of insights.
There are a lot of stories like this for large companies, which have put Power BI on the data they have, and gotten good insights on things they already have in their system.
Use cases with small customers
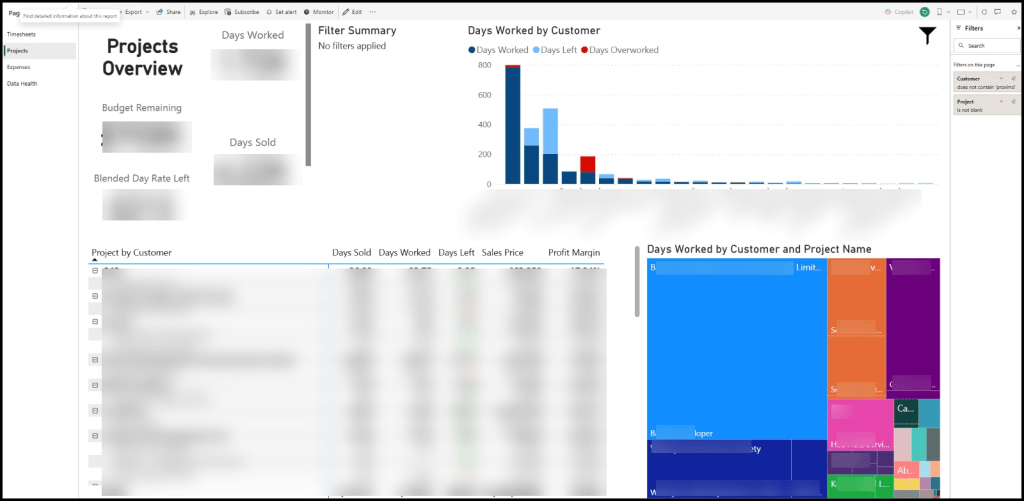
A Microsoft partner I often work with, who are doing good work, is Proximo 3. They use Power BI to get an overview of their projects. All this information is collected from Dataverse and Dynamics 365 to get them a great overview of projects.
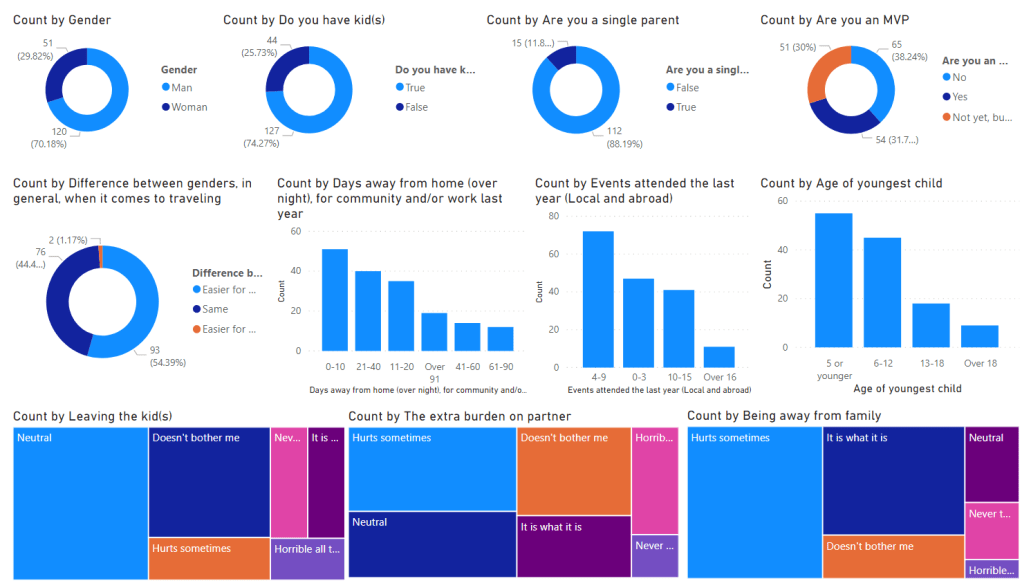
Back in 2019 I created a survey asking people in the community about their travel habits in community work, some background information and what was hard about the travel. I had a simple form, got the data in Excel and created a Power BI report to show the statistics.
Training material
Microsoft Learn has good training:
Dashboard in a Day: https://learn.microsoft.com/en-us/training/paths/dashboard-in-a-day/
Get started with Microsoft data analytics learning path: https://learn.microsoft.com/en-us/training/paths/data-analytics-microsoft/
Design and manage analytics solutions using Power BI: https://learn.microsoft.com/en-us/training/courses/pl-300t00
Laura Graham-Browns blog is a goldmine of good things: https://hatfullofdata.blog/
Power BI Tutorial for Beginners – https://youtu.be/KAdHFEmIZxE
MVP Lucrecia Krause has created a great post to get started as a data analyst: https://techwomenmentoring.wixsite.com/dataanalysisbimentor
Summary
You probably have so much data, but are you getting what your data is trying to tell you? Power BI can be the tool that shows you what your data is trying to tell you. You can have pretty reports in lots of colours, but more important, you can have good reports that help you make data driven decisions.

1 thought on “What is Power BI and what is it used for?”